Please leave your contacts, we will send you our whitepaper by email
I consent to process my personal data in order to send personalized marketing materials in accordance with the Privacy Policy. By confirming the submission, you agree to receive marketing materials
Thank you!
The form has been successfully submitted.
Please find further information in your mailbox.
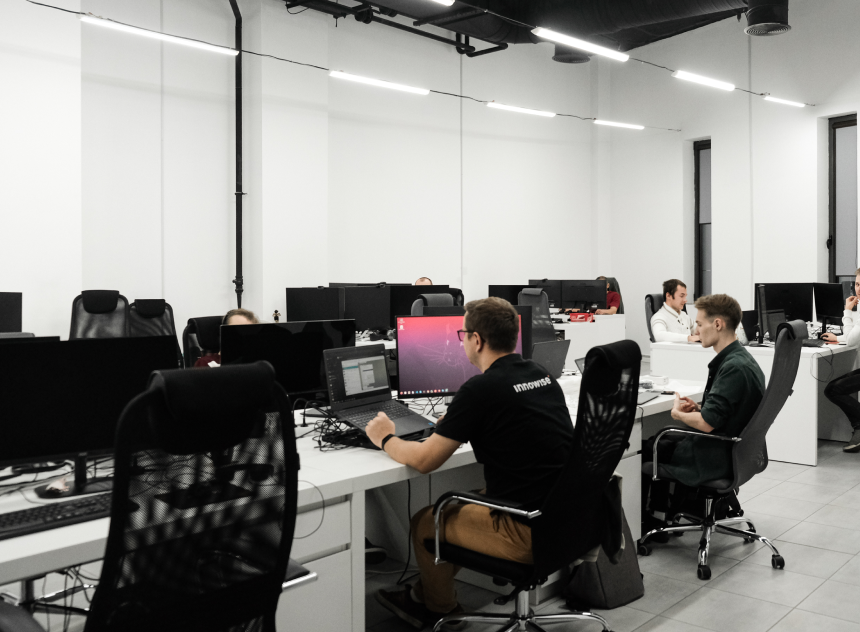
Innowise is an international full-cycle software development
company founded in 2007. We are a team of 1600+ IT professionals developing software for other
professionals worldwide.
Download whitepaper
About us
Services
Technologies
Industries
en English
About us
Innowise is an international full-cycle software development
company founded in 2007. We are a team of 1600+ IT professionals developing software for other
professionals worldwide.
Download overview
Technologies
All
technologies